JOS 实验一
- Part 1: PC BootStrap
Exercise 1
Familiarize yourself with the assembly language materials available on the 6.828 reference page . You don’t have to read them now, but you’ll almost certainly want to refer to some of this material when reading and writing x86 assembly.
We do recommend reading the section “The Syntax” in Brennan’s Guide to Inline Assembly . It gives a good (and quite brief) description of the AT&T assembly syntax we’ll be using with the GNU assembler in JOS.
Exercise 2
Use GDB’s si (Step Instruction) command to trace into the ROM BIOS for a few more instructions, and try to guess what it might be doing.You might want to look at Phil Storrs I/O Ports Description , as well as other materials on the 6.828 reference materials page . No need to figure out all the details – just the general idea of what the BIOS is doing first.
Part 2: The Boot Loader
Exercise 3
Take a look at the lab tools guide, especially the section on GDB commands. Even if you’re familiar with GDB, this includes some esoteric GDB commands that are useful for OS work.
Set a breakpoint at address 0×7c00, which is where the boot sector will be loaded. Continue execution until that breakpoint. Trace through the code in boot/boot.S, using the source code and the disassembly file obj/boot/boot.asm to keep track of where you are. Also use the x/i command in GDB to disassemble sequences of instructions in the boot loader, and compare the original boot loader source code with both the disassembly in obj/boot/boot.asm and GDB.
Trace into bootmain() in boot/main.c, and then into readsect(). Identify the exact assembly instructions that correspond to each of the statements in readsect(). Trace through the rest of readsect() and back out into bootmain(), and identify the begin and end of the for loop that reads the remaining sectors of the kernel from the disk. Find out what code will run when the loop is finished, set a breakpoint there, and continue to that breakpoint. Then step through the remainder of the boot loader.
在一切开始之前,我们要弄懂如何调用 gdb 调试运行在 qemu 虚拟的计算机中的系统。
资料上说运行
make qemu-gdb
那么 make 是什么?为什么 qemu-gdb 作为参数就可以调试了?
Make gets its knowledge of how to build your program from a file called the makefile, which lists each of the non-source files and how to compute it from other files. When you write a program, you should write a makefile for it, so that it is possible to use Make to build and install the program
make 是个按照规则执行批处理操作的工具。
JOS 中规则文件叫 GNUmakefile,其中定义了编译、调用虚拟机、调试相关的规则,下面列出对我们这次实验有用的参数
- make ``编译 JOS``
- make qemu ``调用配置 qemu 载入 JOS 镜像``
- make qemu-gdb ``调用配置 qemu 载入 JOS 镜像并连接 GDB 供调试``
问题弄懂后开始实践,切换到JOS源代码目录
make qemu-gdb
打开另一个终端,运行 gdb
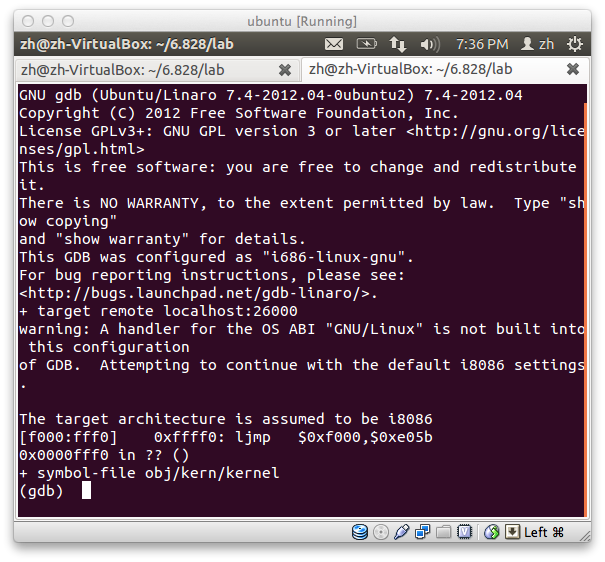
然后一个新终端,运行 gdb 就可以开始调试了,我们可以运行很多命令,比如:
在 0×7c00 处下断点
b *0x7c00
继续运行
c
下一步
si
Be able to answer the following questions:
- At what point does the processor start executing 32-bit code? What exactly causes the switch from 16- to 32-bit mode?
- What is the last instruction of the boot loader executed, and what is the first instruction of the kernel it just loaded?
- Where is the first instruction of the kernel?
- How does the boot loader decide how many sectors it must read in order to fetch the entire kernel from disk? Where does it find this information?
1. CPU 中有个寄存器叫 CR0,它 每一位都是个标示符 ,其中第 0 位用来标识 CPU 是运行在实时模式还是保护模式。所以从头开始找到修改 CRO 第 0 位的代码也就找到了使 CPU 切换到 32 位的代码。
计算机在启动后会调用 BIOS,它做完基础的系统初始化工作,比如检查内存容量后会把启动分区第一扇区的 bootloader 读到内存 0×7c00 处,交给 bootloader 控制权,执行它。
JOS 的 bootloader 由 /boot/boot.s 和 /boot/mian.c 两部分组成,当执行 bootloader 时首先运行的是 boot.s ,所以我们从这里开始看。
找到
# Switch from real to protected mode, using a bootstrap GDT
# and segment translation that makes virtual addresses
# identical to their physical addresses, so that the
# effective memory map does not change during the switch.
lgdt    gdtdesc
movl    %cr0, %eax
orl     $CR0_PE_ON, %eax
movl    %eax, %cr0

# Jump to next instruction, but in 32-bit code segment.
# Switches processor into 32-bit mode.
ljmp    $PROT_MODE_CSEG, $protcseg
往前看到
.set CR0_PE_ON, 0x1 # protected mode enable flag
这就是把 CR0 的 0 位改为 1 ,使 CPU 切换到 32 位保护模式的地方。
2.阅读 boot.s 发现在最后它去运行了 main.c 中的 bootmain
# Set up the stack pointer and call into C.
movl    $start, %esp
call bootmain
bootmain,最后一行代码即 bootloader 最后一行代码
// call the entry point from the ELF header
// note: does not return!
((void (*)(void)) (ELFHDR->e_entry))();
整个 bootmain 做的事情就是把 ELF 格式的内核镜像载入内存,然后去叫内核的入口,ELF 格式的详细信息前面的资料有。
这时我们可以说 bootloader 最后一行代码就是去执行 e_entry 启动内核。
那么内核第一句执行的是什么?
先看 main.c
#define ELFHDR ((struct Elf *) 0x10000) // scratch space
内核从内存 0×10000 开始。
但
objdump -x obj/kern/kernel
看到
SYMBOL TABLEL
f0100000 l     d .text 00000000 .text
f010000c g       .text 00000000 entry
0xf01000c – (0xf0100000 – 0×00100000) = 0×0010000c 就是内核入口地址。
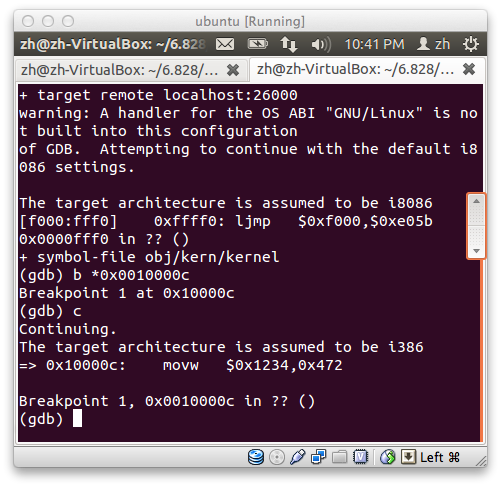
内核执行的第一句代码是
movw $0x1234, 0x472
3. 内核第一句话在 obj/kern/Kernel.asm 中
entry:
        movw    $0x1234, 0x472     #warm boot
4.这个操作系统老实说 ELF 这种格式决定了所有关于 sector 的信息都存在文件头了,bootmain 中把读入的头转换成了 Proghdr,里面就是 sector 的信息,具体以后添加。
Exercise 4
Read about programming with pointers in C. The best reference for the C language is The C Programming Language by Brian Kernighan and Dennis Ritchie (known as ‘K&R’). We recommend that students purchase this book (here is an Amazon Link ) or find one of MIT’s 7 copies= .
Read 5.1 (Pointers and Addresses) through 5.5 (Character Pointers and Functions) in K&R. Then download the code for pointers.c , run it, and make sure you understand where all of the printed values come from. In particular, make sure you understand where the pointer addresses in lines 1 and 6 come from, how all the values in lines 2 through 4 get there, and why the values printed in line 5 are seemingly corrupted.
There are other references on pointers in C, though not as strongly recommended. A tutorial by Ted Jensen that cites K&R heavily is available in the course readings.
Warning: Unless you are already thoroughly versed in C, do not skip or even skim this reading exercise. If you do not really understand pointers in C, you will suffer untold pain and misery in subsequent labs, and then eventually come to understand them the hard way. Trust us; you don’t want to find out what “the hard way” is.
#include <stdio.h>
#include <stdlib.h>

void
f(void)
{
    int a[4];
    int *b = malloc(16);
    int *c;
    int i;

    printf("1: a = %p, b = %p, c = %p\n", a, b, c);

    c = a;
    for (i = 0; i < 4; i++)
	a[i] = 100 + i;
    c[0] = 200;
    printf("2: a[0] = %d, a[1] = %d, a[2] = %d, a[3] = %d\n",
	   a[0], a[1], a[2], a[3]);

    c[1] = 300;
    *(c + 2) = 301;
    3[c] = 302;
    printf("3: a[0] = %d, a[1] = %d, a[2] = %d, a[3] = %d\n",
	   a[0], a[1], a[2], a[3]);

    c = c + 1;
    *c = 400;
    printf("4: a[0] = %d, a[1] = %d, a[2] = %d, a[3] = %d\n",
	   a[0], a[1], a[2], a[3]);

    c = (int *) ((char *) c + 1);
    *c = 500;
    printf("5: a[0] = %d, a[1] = %d, a[2] = %d, a[3] = %d\n",
	   a[0], a[1], a[2], a[3]);

    b = (int *) a + 1;
    c = (int *) ((char *) a + 1);
    printf("6: a = %p, b = %p, c = %p\n", a, b, c);
}

int
main(int ac, char **av)
{
    f();
    return 0;
}
输出结果为
1: a = 0x7fff5e0fe4c0, b = 0x7fca114000e0, c = 0x7fff61701740
2: a[ 0 ] = 200, a[ 1 ] = 101, a[ 2 ] = 102, a[ 3 ] = 103
3: a[ 0 ] = 200, a[ 1 ] = 300, a[ 2 ] = 301, a[ 3 ] = 302
4: a[ 0 ] = 200, a[ 1 ] = 400, a[ 2 ] = 301, a[ 3 ] = 302
5: a[ 0 ] = 200, a[ 1 ] = 128144, a[ 2 ] = 256, a[ 3 ] = 302
6: a = 0x7fff5e0fe4c0, b = 0x7fff5e0fe4c4, c = 0x7fff5e0fe4c1
其中
c = (int *) ((char *) a + 1);
每个 int 占用 4 字节,而 char 占 1 字节,所以 (char *)a + 1 的结果为 a 后的 1 字节,再(int *)后,c 为指向由 a[ 0 ] 后 3 字节与 a[ 1 ] 组成的 int 的指针。
观察
6: a = 0x7fff5e0fe4c0, b = 0x7fff5e0fe4c4, c = 0x7fff5e0fe4c1
结论得证。
Exercise 5
Trace through the first few instructions of the boot loader again and identify the first instruction that would “break” or otherwise do the wrong thing if you were to get the boot loader’s link address wrong. Then change the link address in boot/Makefrag to something wrong, run make clean, recompile the lab with make, and trace into the boot loader again to see what happens. Don’t forget to change the link address back and make clean again afterward!
Exercise 6
We can examine memory using GDB’s x command. The GDB manual has full details, but for now, it is enough to know that the command x/Nx ADDR prints N words of memory at ADDR . (Note that both ’x’s in the command are lowercase.) Warning: The size of a word is not a universal standard. In GNU assembly, a word is two bytes (the ‘w’ in xorw, which stands for word, means 2 bytes).
Reset the machine (exit QEMU/GDB and start them again). Examine the 8 words of memory at 0×00100000 at the point the BIOS enters the boot loader, and then again at the point the boot loader enters the kernel. Why are they different? What is there at the second breakpoint? (You do not really need to use QEMU to answer this question. Just think.)
BIOS 刚进入 boot loader 时,内存里只有 从 0×7c00 开始的 boot loader,它有(待填)大,0x00100000 空,boot loader 执行完把内核载入到从 0×10000 开始的地方,0x00100000 区域被用来放内核了,里面内容不再为空。Easy?
Part 3: The Kernel
Exercise 7
Use QEMU and GDB to trace into the JOS kernel and stop at the movl %eax, %cr0. Examine memory at 0×00100000 and at 0xf0100000. Now, single step over that instruction using the stepi GDB command. Again, examine memory at 0×00100000 and at 0xf0100000. Make sure you understand what just happened.
What is the first instruction after the new mapping is established that would fail to work properly if the mapping weren’t in place? Comment out the movl %eax, %cr0 in kern/entry.S, trace into it, and see if you were right.
%eax, %cr0
后启用了虚拟地址转换,然后 0xf0100000 就被映射成 0×0010000,所以都一样了。
Exercise 8
We have omitted a small fragment of code – the code necessary to print octal numbers using patterns of the form “%o”. Find and fill in this code fragment.
终于开始要写代码了,第一个问题非常简单,找到 printfmt.c 中的 vprintfmt 函数
void vprintfmt(void (*putch)(int, void*), void *putdat, const char *fmt, va_list ap)
里面处理了各种参数,很好玩的是,这个函数的实现用了 goto 语句,找到 case “o” ,这就是 8 进制相关的代码,照猫画虎,改成:
case 'o':
	num = getuint(&ap, lflag);
	base = 8;
	goto number;
好了,我们的 print 函数升级了,重新运行 JOS,不开 debug,输出如下:
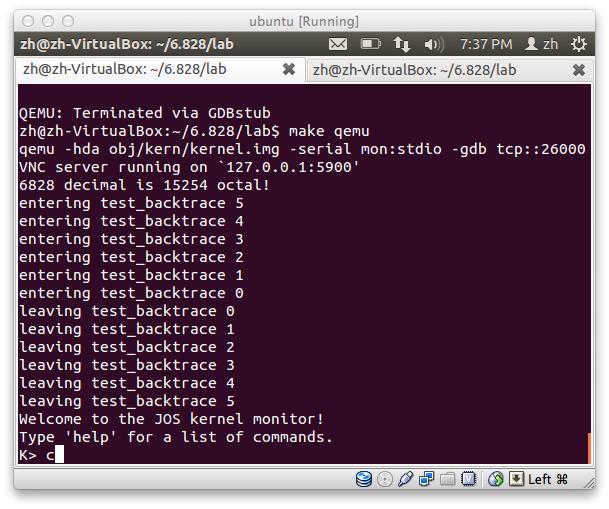
6828 decimal is 15254 octal!
Be able to answer the following questions:
1. Explain the interface between printf.c and console.c. Specifically, what function does console.c export? How is this function used by printf.c?
printf.c 中的
static void
putch(int ch, int *cnt)
{
	cputchar(ch);
	*cnt++;
}
调用了 console.c 中的 putch,它的功能就是和硬件打交道打印一个字符
// output a character to the console
static void
cons_putc(int c)
{
	serial_putc(c);
	lpt_putc(c);
	cga_putc(c);
}
2. Explain the following from console.c:
if (crt_pos >= CRT_SIZE) {
    int i;
    memcpy(crt_buf, crt_buf + CRT_COLS, (CRT_SIZE - CRT_COLS) * sizeof(uint16_t));
    for (i = CRT_SIZE - CRT_COLS; i < CRT_SIZE; i++)
        crt_buf[i] = 0x0700 | ' ';
        crt_pos -= CRT_COLS;
}
3. For the following questions you might wish to consult the notes for Lecture 2. These notes cover GCC’s calling convention on the x86.
Trace the execution of the following code step-by-step:
int x = 1, y = 3, z = 4;
cprintf("x %d, y %x, z %d\n", x, y, z);
- In the call to cprintf(), to what does fmt point? To what does ap point?
- List (in order of execution) each call to cons_putc, va_arg, and vcprintf. For cons_putc, list its argument as well. For va_arg, list what ap points to before and after the call. For vcprintf list the values of its two arguments.
fmt 指向 “x %d, y %x, z %d\n” 的头,也就是" " ",ap指向 xyz 所组成内存区域的头, 也就是 x。
4. Run the following code.
unsigned int i = 0x00646c72;
cprintf("H%x Wo%s", 57616, &i);
What is the output? Explain how this output is arrived at in the step-by-step manner of the previous exercise. Here’s an ASCII table that maps bytes to characters.
The output depends on that fact that the x86 is little-endian. If the x86 were instead big-endian what would you set i to in order to yield the same output? Would you need to change 57616 to a different value?
Here’s a description of little- and big-endian and a more whimsical description.
得到打印结果是
He110 World!
根据 ASSIC 表查到 0×00646c72 对应:
d     100 0144 0x64
l     108 0154 0x6c
r     114 0162 0x72
(nul)   0 0000 0x00
57616 十六进制对应:
e11
看对应结果知道我们的机器是 big-endian.
5. In the following code, what is going to be printed after ‘y=’? (note: the answer is not a specific value.) Why does this happen?
cprintf("x=%d y=%d", 3);
当 printfmt 的 ap 去找 y 的时候,那块内存区域没有被正确赋值,所以内容不是我们想要的。
6. Let’s say that GCC changed its calling convention so that it pushed arguments on the stack in declaration order, so that the last argument is pushed last. How would you have to change cprintf or its interface so that it would still be possible to pass it a variable number of arguments?
The Stack
Exercise 9
Determine where the kernel initializes its stack, and exactly where in memory its stack is located. How does the kernel reserve space for its stack? And at which “end” of this reserved area is the stack pointer initialized to point to?
entry.S 中 stack 初值被设置为空指针 0×0
# Clear the frame pointer register (EBP)
# so that once we get into debugging C code,
# stack backtraces will be terminated properly.
movl    $0x0,%ebp           # nuke frame pointer

# Set the stack pointer
movl    $(bootstacktop),%esp

# now to C code
call    i386_init
再看定义:
.data
###################################################################
# boot stack
###################################################################
    .p2align    PGSHIFT     # force page alignment
    .globl      bootstack
bootstack:
    .space      KSTKSIZE
    .globl      bootstacktop
bootstacktop:
stack 大小 KSTKSIZE (32KB),栈低就是 bootstacktop。
Exercise 10
To become familiar with the C calling conventions on the x86, find the address of the test_backtrace function in obj/kern/kernel.asm, set a breakpoint there, and examine what happens each time it gets called after the kernel starts. How many 32-bit words does each recursive nesting level of test_backtrace push on the stack, and what are those words?
Note that, for this exercise to work properly, you should be using the patched version of QEMU available on the tools page or on Athena. Otherwise, you’ll have to manually translate all breakpoint and memory addresses to linear addresses.
这个在北京大学 JOS 实验一中说的很清楚了,共 32bit 被压入栈中。
Exercise 11
Implement the backtrace function as specified above. Use the same format as in the example, since otherwise the grading script will be confused. When you think you have it working right, run make grade to see if its output conforms to what our grading script expects, and fix it if it doesn’t. After you have handed in your Lab 1 code, you are welcome to change the output format of the backtrace function any way you like.
Exercise 12
Modify your stack backtrace function to display, for each eip, the function name, source file name, and line number corresponding to that eip.
In debuginfo_eip, where do __STAB_* come from? This question has a long answer; to help you to discover the answer, here are some things you might want to do:
look in the file kern/kernel.ld for __STAB_*
run i386-jos-elf-objdump -h obj/kern/kernel
run i386-jos-elf-objdump -G obj/kern/kernel
run i386-jos-elf-gcc -pipe -nostdinc -O2 -fno-builtin -I. -MD -Wall -Wno- format -DJOS_KERNEL -gstabs -c -S kern/init.c, and look at init.s.
see if the bootloader loads the symbol table in memory as part of loading the kernel binary
Complete the implementation of debuginfo_eip by inserting the call to stab_binsearch to find the line number for an address.
Add a backtrace command to the kernel monitor, and extend your implementation of mon_backtrace to call debuginfo_eip and print a line for each stack frame of the form:

K> backtrace
Stack backtrace:
  ebp f010ff78  eip f01008ae  args 00000001 f010ff8c 00000000 f0110580 00000000
         kern/monitor.c:143: monitor+106
  ebp f010ffd8  eip f0100193  args 00000000 00001aac 00000660 00000000 00000000
         kern/init.c:49: i386_init+59
  ebp f010fff8  eip f010003d  args 00000000 00000000 0000ffff 10cf9a00 0000ffff
         kern/entry.S:70: <unknown>+0
K>
Each line gives the file name and line within that file of the stack frame’s eip, followed by the name of the function and the offset of the eip from the first instruction of the function (e.g., monitor+106 means the return eip is 106 bytes past the beginning of monitor).
Be sure to print the file and function names on a separate line, to avoid confusing the grading script.
Tip: printf format strings provide an easy, albeit obscure, way to print non-null-terminated strings like those in ST ABS tables. printf(“%.*s”, length, string) prints at most length characters of string. Take a look at the printf man page to find out why this works.
You may find that some functions are missing from the backtrace. For example, you will probably see a call to monitor() but not to runcmd(). This is because the compiler in-lines some function calls. Other optimizations may cause you to see unexpected line numbers. If you get rid of the -O2 from GNUMakefile, the backtraces may make more sense (but your kernel will run more slowly).

两个练习合起来一起做:
eip_debuginfo 中实现查找行数的代码,具体为什么这么实现,实际上我就是按照代码注释说的逻辑翻译成代码。
  stab_binsearch(stabs, &lline, &rline, N_SLINE, addr);
  if(lline > rline)
    return -1;
  info.eip_line =  stabs[rline].n_desc;

在终端中加入 backrace 命令:
static struct Command commands[] = {
    { "help", "Display this list of commands", mon_help },
    { "kerninfo", "Display information about the kernel", mon_kerninfo },
    { "backtrace", "Display function stack one line at a time",mon_backtrace},
};

弄明白 debuginfo_eip ,利用它实现 mon_backtrace:
int
mon_backtrace(int argc, char **argv, struct Trapframe *tf)
{
    uint32_t *ebp = (uint32_t*)read_ebp();
    struct Eipdebuginfo info;

    cprintf ("Stack backtrace:\n");
    while (ebp != 0x0){
        cprintf (" ebp %08x eip %08x args %08x %08x %08x %08x %08x\n", ebp, ebp[1]
                 , ebp[2], ebp[3], ebp[4], ebp[5], ebp[6]);

        debuginfo_eip(ebp[1],&info);
        cprintf ("%s:%d: %.*s+%d\n",info.eip_file
                    ,info.eip_line
                    ,info.eip_fn_namelen,info.eip_fn_name
                    ,ebp[1]-info.eip_fn_addr);

        ebp = (uint32_t*) ebp[0];
    }

    return 0;
}
好了,这时候运行 :
make grade
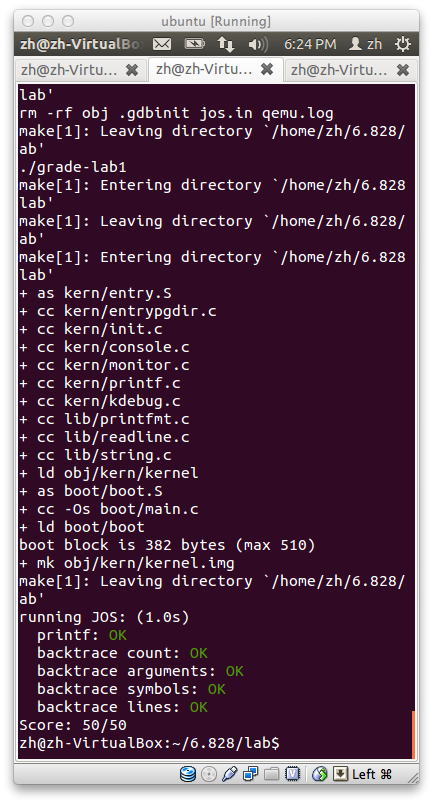
实验一完成。